General
GTX is an interactive tool and programming framework for the interactive visualization of large spatio-temporal data sets in geographic contexts. It provides flexible cartographic information at different levels focused on interactive 3D visualisation of large time-dependent data sets. GTX has been developed both for visual analytics of spatio-temporal trajectory data such as air-traffic movements and for interactive visualisation of large geo-referenced (climate-)networks, and can easily be extended to support other kinds of spatio-temporal data sets.
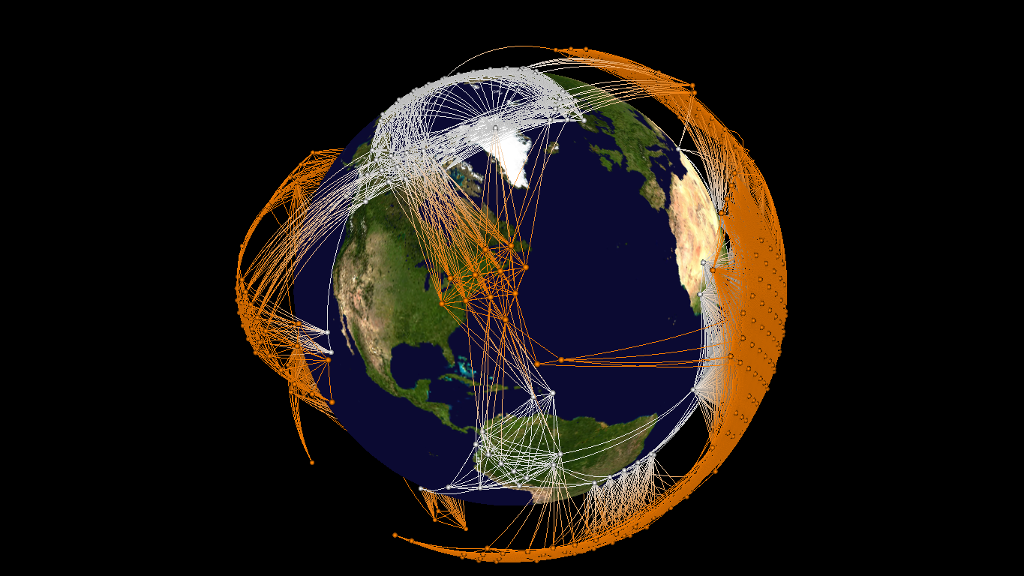
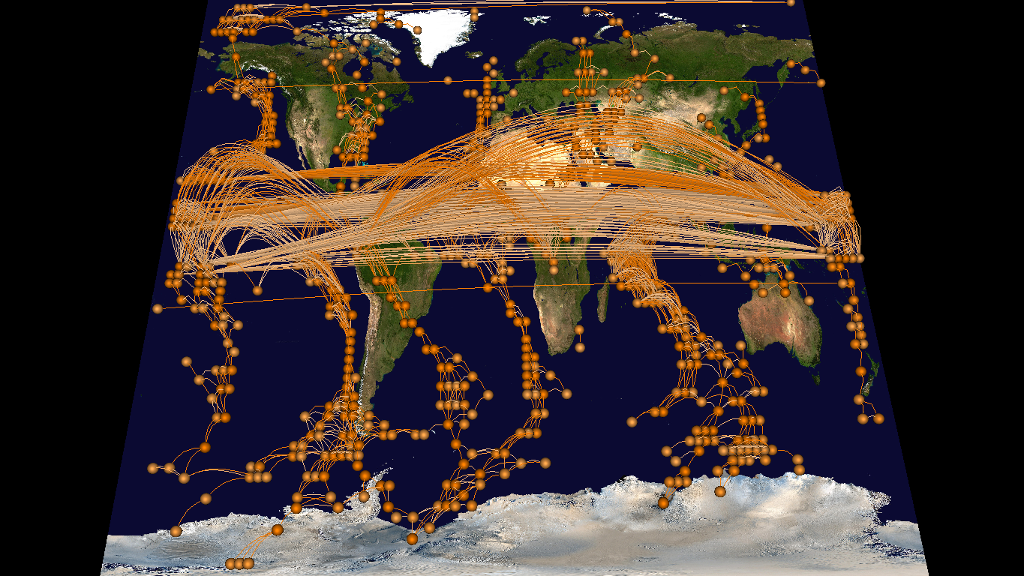
GTX supports both 3D globe representations and 2D geographic projections such as Mercator, transverse Mercator, and circular projection. These representations can be changed on the fly by user interaction, enabling quick comparisons of different projections. Due to the hardware- accelerated implementation, both filtering and mapping options can be configured interactively.
All of the visualisation options in GTX (i.e., filtering, mapping, geographic projections, and camera options) can be accessed by a scripting interface, using JavaScript as its programming language. This enables scientists to reproduce and share their visualisation configurations, to enhance or implement their own analysis functions on climate network data and visualise their results, and to script reproducible screenshots or even videos for presentation purposes.
Trajectory Visualization
GTX has been developed as a visual analytics tool for spatio-temporal data sets, in particular 2D/3D trajectories of moving objects. It supports the visualization of large amounts of movement trajectories and enables users to interactively explore data sets by means of filtering, selection, and interactive attribute mapping.
GTX supports both an animated visualization of movement trajectories and the automatic generation and visualization of aggregated density maps. In combination, these techniques enable users to explore and analyse large data sets interactively in a graphical way. Interactive attribute mapping can be used to map trajectory attributes to visual variables such as shape, width, color, or height, while temporal filtering and exploration can be used to highlight temporal aspects of the data.
Climate Network Visualization
Geo-referenced networks, such as complex climate networks representing climate phenomena on a large scale, often consist of large graph data (1000 − 1,000,000 nodes and 1-100 million edges). This requires specialized tools to support interactive visualization, exploration, and analysis of such big data sets.
GTX has been developed to support visualization of large climate networks. It is able to process up to 1,000,000 edges at interactive frame rates by combining sophisticated computer graphics and GIS technologies. In particular, data representation and processing is optimised by storing attributed network data in graphics card memory and creating complex geometry on the GPU during rendering, instead of precomputing it on the CPU. This reduces memory consumption and facilitates interaction by avoiding slow recomputation and updates of geometry data from CPU to GPU memory.
As a result, it allows for filtering, mapping, and rendering options to be configured interactively and updated on the fly, thus enabling interactive exploration and analysis by giving direct visual feedback to user interaction. In addition, rendering is optimised by minimising the geometric complexity, using techniques such as billboards to render spheres without tessellation and level-of-detail (LOD) to reduce the visual complexity for edges based on the distance from the virtual camera.